A Gantt Chart is typically a kind of bar chart, commonly used as a tool in project management to plan and schedule projects of all sizes by displaying activities against time. It is a visual view of a project task schedule over time. Some people may think of Gantt charts as an old-fashioned and messy method of managing project operations but they couldn’t be more wrong in assuming so because practically Gantt charts are great tools for making a project schedule and process more effective. They are mostly used in project management operations to track project schedules and present additional information related to specific tasks or areas of a project such as task progress, dependencies on other project operations, the relative importance of the tasks and resources being consumed for the tasks.

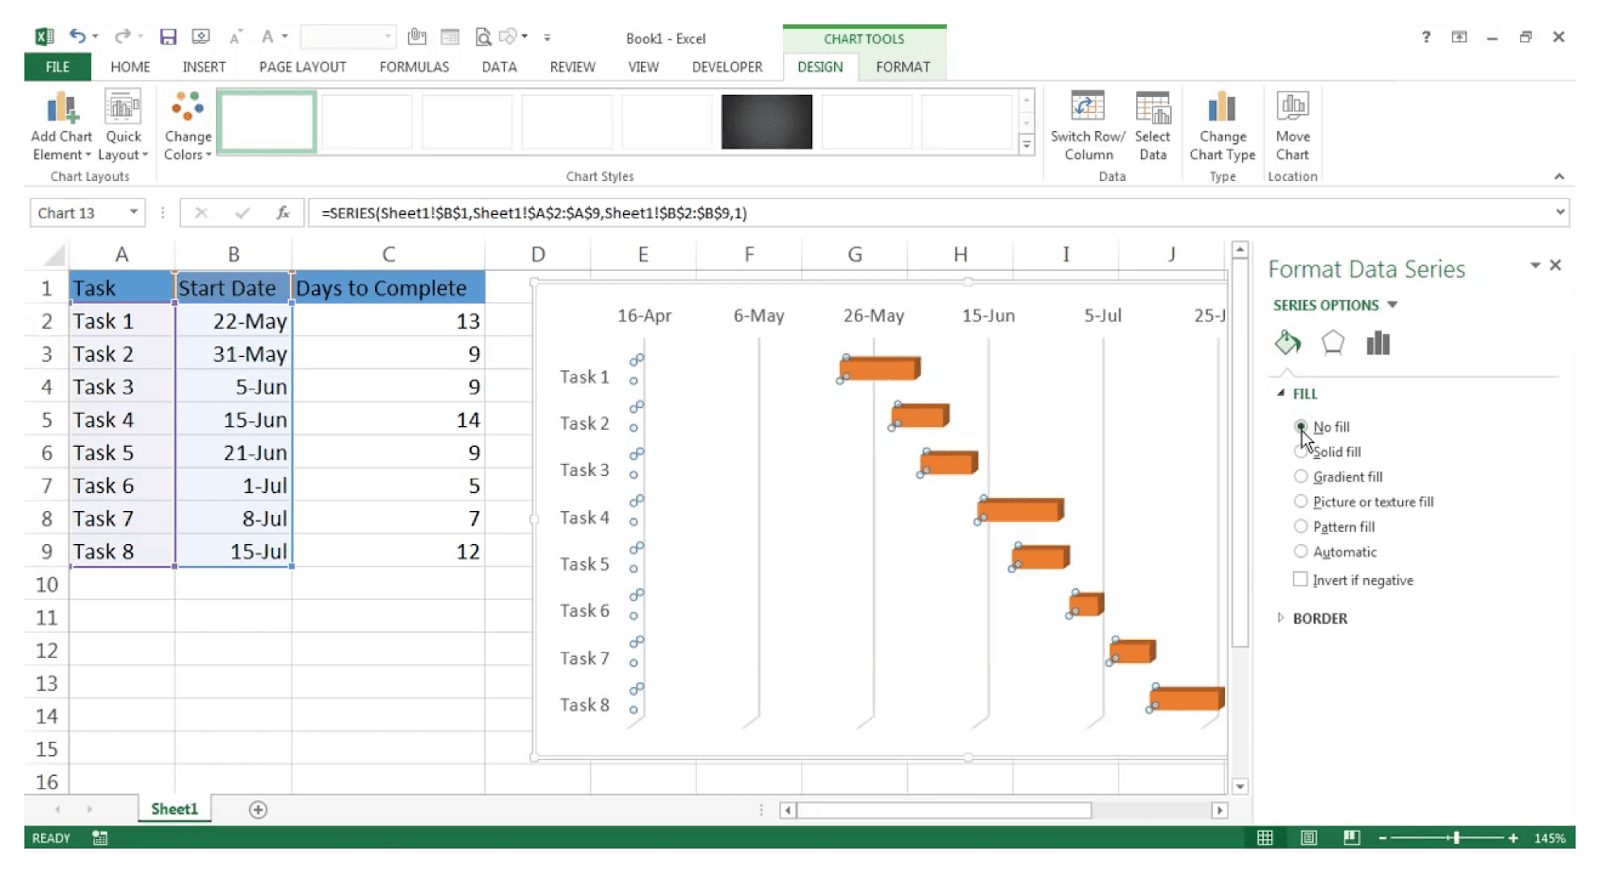
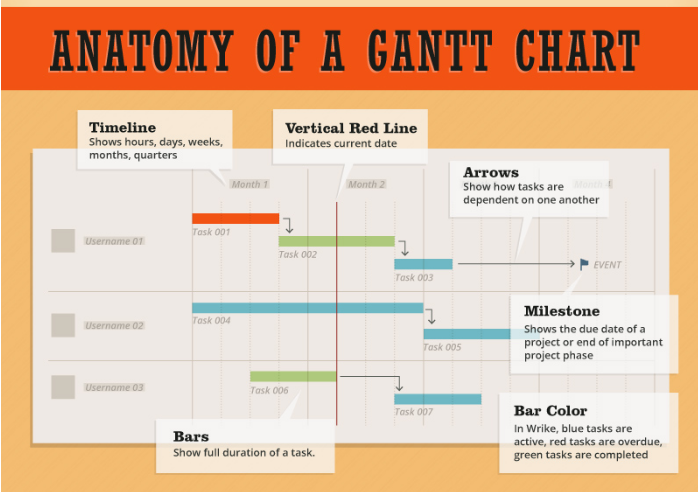
One of the best things about Gannt charts is that they are exceptionally illustrative because of which you can not only see the list of necessary tasks at any given time but also the timescale associated with the tasks. While preparing a Gantt chart, the list of tasks as per priority is arranged on the left side of the chart and the timescale to portray the task schedule is placed on the top of the chart. Each task is represented by a bar and the duration of the task is represented by the bar’s length. The title of the activity along with any other important information can be placed adjacent to the bar in the same column or on top of the bar itself.

History of Gantt Charts
One of the first kinds of tools similar to Gantt charts was created and utilized in the mid-1980s by a Polish engineer turned management professor, Karol Adameicki who wanted to display visual processes to ease the process of tracking and reviewing project schedules in the steel industry. He named it the ‘Harmonogram’. However, his version of the chart was nothing compared to the Gantt charts that we know today and was published several years later in 1931, that too only in Polish and Russian, which limited its reach and his subsequent authorship.

There was another person named Hermann Shurch in Germany who created a similar tool in the year 1912 for his construction project. His version of Gantt charts were relatively simple and were not considered as a special tool at that time in his country. His charts were quite static, related to a single planned schedule and also, there were no interdependencies.

Henry L. Gantt was an American engineer and a project management consultant who had designed and started using his version of the Gantt Charts around the years 1910- 1915. It was this version of the chart which became widely known and popular in western countries and subsequently came to be known as Gantt charts from Henry Gantt reference. The charts used by him were only the foundation of what we use today and those charts had many drawbacks which made it difficult to use them for major project management processes.
Gantt Charts through the Years
Initially, Gantt charts could only be prepared manually by hand as Bar charts which was quite a laborious task as it was necessary to correct and redraw the entire chart all over again each time a project was changed. Since most of the projects that needed proper scheduling and management were prone to frequent changes, the amount of rework involved limited the usefulness of Gantt charts.

With the onset of computers and the development of more powerful systems, it became easier to modify, customize and create more complex versions of Gantt charts. Unique charts can be created, modified and adjusted in numerous ways using advanced programs developed to utilize Gantt charts. With the advent of graphical user interfaces such as Windows and Macintosh, planners could modify logic, time and resource rendering on screens which allowed overlaying of the linking logic onto the Gantt chart.

In recent times, specialized project management tools based on Gantt charts have been developed and are being used extensively to improve project management. These tools are great for any project management process that has to be carried out and possess numerous features with customizable options that are suitable and perfect for all kinds of projects. Be it a complex construction project with lots of variables and a large workforce or a small-scale project with a workforce of less than 10 people, Gantt charts and their respective tools can be used to make the entire project process much simpler and easier.
Why use Gantt charts?
What are Gantt charts used for and why are they used?
Let’s answer the question step by step- Firstly Gantt charts are said to be useful for leaders, not because leaders use these charts to lead but because they have inspired and motivated people to become a leading example by doing their tasks in a planned way. Similarly, Gantt charts help you achieve your project goals in a simple and effectively-planned manner due to which they are of great help to planners and managers.
While preparing a Gantt chart not only do you think through all the tasks involved in a project schedule but also determine the people who can be given the responsibility for each task, the duration of the task and the associated risks before starting the project. This detailed thought process can also assist in determining whether the project schedule is workable or not, the right people have been assigned to the right tasks or not and the effective solutions have been already worked out before the start of the project in case of any problem.
Gantt charts can also be utilized to work out realistic aspects of a project like the minimum time requirement for a project to be completed and delivered, the tasks which need to be completed before a specific task or set of tasks. Along with working out the project schedule aspects, Gantt charts can also be used to determine the critical path for the project process, i.e., the arrangement of all the tasks in such a way that the entire project is completed on time when all the individual tasks are completed within the given duration.
With the gradual progress of a project, a Gantt chart can be adjusted simultaneously to display an updated real-time project schedule so that everybody involved with the project is informed about the progress. Too many meetings can be avoided and replaced with Gantt charts for status updates. It becomes easier for the members involved in an activity to analyze task progress and talk about specific problems that they encounter through the task or project progress.
Conclusively, Gantt charts or Gantt chart tools are extremely useful during project management operations because they give you a visual representation of the project progress against the timeline in which it has to be completed.
Steps to Prepare a Gantt Chart

To create Gantt charts for a particular project the following steps can be performed:
- Identify the Essential Operations- Along with the planning team review the scope of the project schedule that can be mainly categorized into three components, the Scope Statement, the Work Breakdown Structure(WBS) and the WBS index. Before mapping out the entire work, the list of work operations must be prepared which must be thorough and complete to maintain efficiency. This list can be prepared and the entire work can be mapped out using WBS. WBS involves breaking down larger, complex projects into numerous individual activities and starts with the final product, step by step backward towards including the essential processes to get to the project’s end.
- Create Activities and Milestones- Each WBS work package can be broken down into a number of activities using a technique called Decomposition. Scheduling of activities must be performed according to a set of rules by the planning team. Breaking down of WBS work package into too many or too few activities can be bad for the project process. Along with this, it is also important to identify milestones and deadlines while breaking up the project. Milestones are important to mark the completion of your project operations or work phases as it helps to include even the smallest of tasks to achieve the bigger picture. Gantt charts help in breaking down the project into work phases to create milestones. Having milestones in a project structure not only boosts morale on accomplishing a chunk of work but also helps in setting out important stages like signposts en route to your final project deliverable.
- Arranging Activities in Sequence- Each activity inside a project is related to one or more activities. Except for the first and last activity, all other activities have some kind of relationship with their predecessors and successors. Therefore, arranging activities in a sequence involves arranging the proper activities in the right order using the appropriate relationships. There are mainly four types of relationships in between activities-
- Finish to Start- The successor activity can only begin after the predecessor activity is finished
- Start to Start- The successor activity can only begin after the predecessor activity has started.
- Start to Finish- The successor activity can only be completed after its predecessor activity has been started.
- Finish to Finish- The successor activity can only be completed after its predecessor activity has been completed.
‘Finish to Start’, a sequential relationship and ‘Start to Start’, a parallel or overlapping relationship are the most commonly used relationships.
- Estimating Resources- Before estimation of task durations, the required resources must be determined and estimated. These resources can include labor, material and equipment. The estimation of these resources can be brought about by using several estimating methodologies such as Bottom Up, Analogous, Parametric and Three-Point. The estimating process depends on several key factors such as the estimator’s skills and competencies, and the technology used for estimation. When the resources have been estimated as per the requirement, they are put up in the project schedule against the respective activities. To know the timewise requirement of different resources, a resource calendar is also created.
- Estimating Durations- The time required by a task between the start and end of an activity is called the duration of the activity. Durations of activities should only be estimated after proper review of resources, activity relationships and activity sequencing. The same methodologies can be used for estimating the duration of the project activities but only under requisite conditions. Some tasks can also occur simultaneously headed by different members. This creates a visual representation of the project laid out over a specific timeframe which provides instant assistance to the project progress once the project has started.
- Develop a Schedule- After all of the above information has been acquired and recorded properly, a Gantt chart has to be prepared by using the information as input into a project management tool. On preparing the chart, review the schedule and make sure that all the risks associated with the schedule have been addressed. Make sure that the response plans and backup schedules have been included in the Gantt chart design logic. One of the typical ways of backing up the schedule is to add buffers at either the project level or activity level or both. A buffer is nothing but a kind of null activity with no resources or scope equipped with it whose main purpose is to provide additional time and reduce the risks related to schedules. Realistic schedules can be prepared with the help of resource optimization techniques such as resource smoothening or leveling. Finally, do a final review of the schedule and approve it, and subsequently, the approved Gantt chart becomes the schedule baseline.

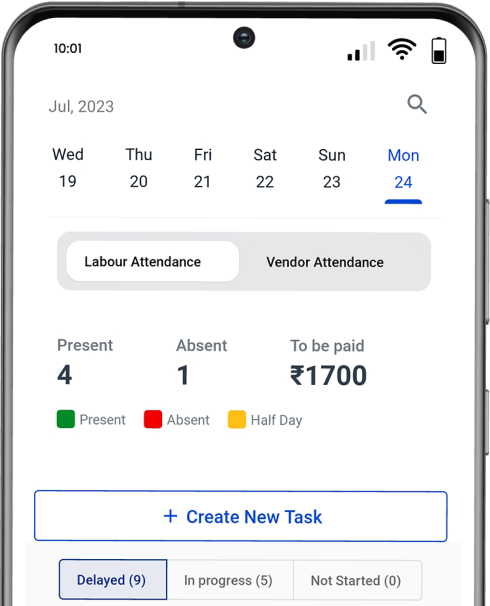
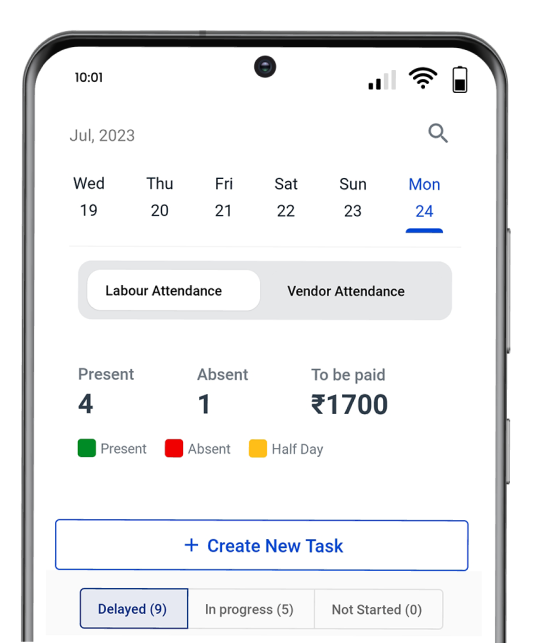
A plethora of construction project management tools in the form of mobile and desktop applications are available in the construction industry. Out of the very many tools, only a few software programs have included the feature of project scheduling using Gantt charts. Powerplay is one such free construction project management tool that helps project managers to understand the project schedules in a much better way using the Gantt Charts feature on its web platform. Being the first of its kind in India, Powerplay has a multitude of functions that make the project management process more efficient and effortless for project planners.